
Europe
going solar
| |
|
||||||
|
Europe
going solar |
index | ||||||
|
|
|
||||
 |
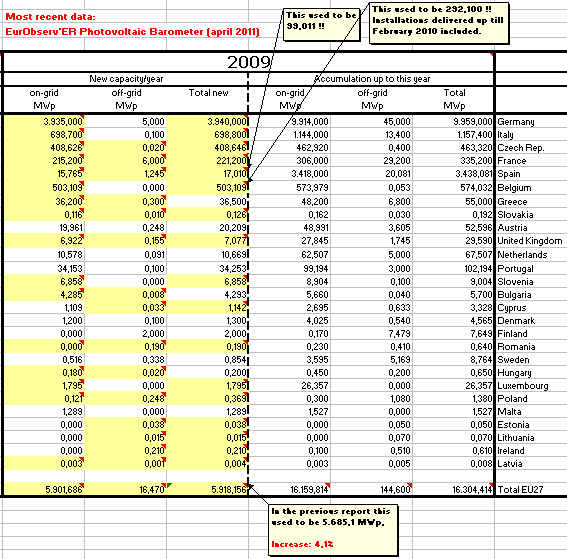
^^^ For Netherlands, CBS published first data in their June 30, 2011 update on the StatLine website. They reported a new volume of only 20,682 MWp added in 2010, almost 30% lower than the 29,393 MWp published by EurObserv'ER. In response to questions on this matter by Polder PV, CBS replied that the latter has been based on incomplete market data and that it must have been a coarse estimate (see article on this subject by Polder PV, July 4th 2011). However, ECN Beleidsstudies later admitted that the entry has been an error: they reported the accumulated "certified" capacity that is registered by CertiQ in the Netherlands. Even if they would have reported new certified capacity for 2010 (CertiQ year report: 11 MWp), this would have ignored the massive amount of PV-installations realized beyond the national "subsidiy scheme" (SDE or the older MEP). And that must have been already 47% of total market realisation, if the CBS and CertiQ numbers are correct. As a result of the correction needed (ECN Beleidsstudies: "CBS data are leading"), accumulated volume for grid-connected systems in 2010 is not 91,9 MWp, but instead, following already reported CBS data, only 82,7 MWp (total volume in the EurObserv'ER table has to be changed accordingly). |
Grafieken
met marktontwikkeling zonnestroom in EU27
Graphs with market development for photovoltaics in EU27
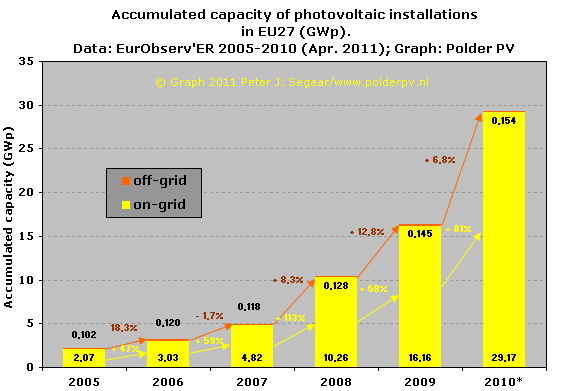
Figure 1. Note - all figure updates based on April 2011 report (Photovoltaic Barometer EurObserv'ER).
Accumulated capacity of photovoltaic installations in the EU27, in GWp (1 GWp = 1.000 MWp = 1.000.000 kWp), in six consecutive years (2005-2010*) according to the latest data reported by EurObserv'ER (note that numbers might have been refreshed in new reports dealing with previous years, the latest data available in these reports have been included here). Data are from the last and previous Photovoltaic Barometer reports. Note that errors in the tables published (see two major mistakes under the heading "Erroneous data" above) have not been corrected in the graphs, since many more corrections are expected in later revisions by EurObserv'ER. Data for 2010 (asterisk) are preliminary and will change as new/adjusted market data will become available.
The graph shows strong growth in the years shown, and an overwhelming dominance of grid-connected systems. Autonomous ("off-grid") systems make up only 0,5% of the EU27 PV market in 2010 (0,9% in 2009) and will dwindle even further in significance as the on-grid market grows with huge new volumes each year. Growth has been even negative between 2006 and 2007 for this small off-grid category. Growth in grid-connected PV has been strong in that period (over 59%), almost doubled to 113 percent from the accumulated 2007 capacity into 2008, grew a considerable 58% in the economic "crisis" year 2009, and, finally, might have increased a further spectacular 81% in 2010 with the market data now available. Accumulated capacity in EU27 amounted to 16,30 GWp in 2009, and an impressive 29,33 GWp in 2010 (59% of which would have accumulated in Germany alone). Corrections will probably follow in the next photovoltaic barometer report or the Barobilan inventory by EurObserv'ER.
CLICK
on graph for enlargement
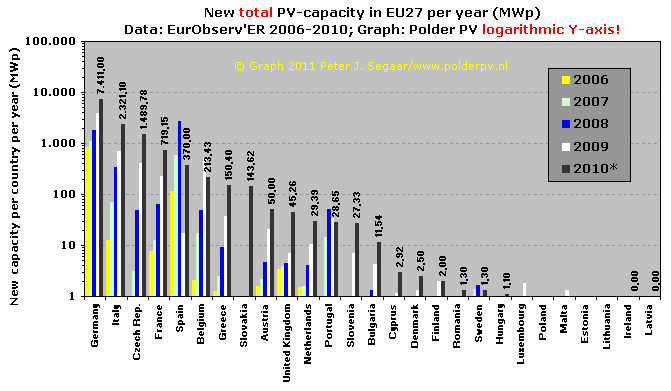
Figure 2. New photovoltaic capacity per country and per year, in MWp. Note that Y-axis is shown in logarithmic scale. Order, from left to right, is related to new market volume for 2010 (note: preliminary data). Only numbers for 2010 are shown for clarity. If "0,000 MWp" has been given by EurObserv'ER, no data are shown in the figure. From this graph - note again, with logarithmic Y-axis - it becomes clear that there are huge differences in market development in EU27 countries, and that fast growing markets develop in different time frames. In addition: such highly lucrative markets might dwindle in a short time if political backing of exceptionally succesfull incentive regimes collapses (e.g. Spain after its 2008 "boom year").
Note that the position of Netherlands will have to be revised because of wrong data reported by ECN Beleidsstudies (see article Sep. 12/13 2011). Most probably, its position will shift from 11th to 14th rank, since CBS reported only 20,7 MWp new installations for 2010.
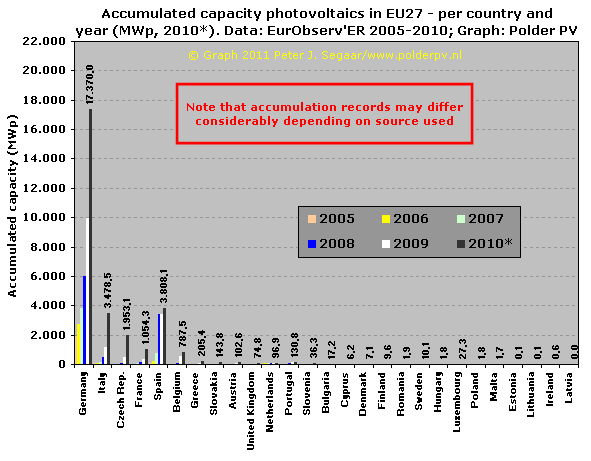
Figure 3. Accumulated PV-capacity per EU27 country for the years 2005-2010 (only for 2010* accumulation is given in numbers for clarity). Sorting order is for new capacity added in 2010, according to the latest EurObserv'ER data (left to right). Note absolute dominance of world market Germany, with almost 17,4 GWp accumulated, end of 2010 (in February of 2010, the 10 GWp milestone has been reached). For the year 2010 a - preliminary - world record increase (difference between dark-grey and white column, over 7,4 GWp in one year) is apparent for Germany. Spain, only one year (2008) worlds' biggest market for new installations, has completely collapsed in 2009 due to severe capping of the new capacity allowed under the FIT regime, regressive limitations to the amount of kWh's subsidized under previous (extremely lucrative) feed-in Law-conditions, accompanying regulatory bureaucracy, much lower feed-in tariffs for new installations, and a land in turmoil with several economic crisis situations. Preliminary data for 2010 suggest, however, a reasonable growth rate of 370 MWp in that year.
According to the EurObserv'ER data, Spain is however only 5th on the new "growth list" for 2010. Italy catapulted itself into an unchallenged second place with a staggering new volume of 2.321 MWp (note: in 2009 "only" 699 MWp), but according to the EuroObserv'ER "statistics policy" several GWp could be added to that volume (according to EPIA statistics policy, those new GWp's, grid-connected in the first half year of 2011, but formally attributed to Conto Energia II, will, however, be attributed to 2011, not to 2010). Italy would already have reached 3,48 GWp in accumulation, end of 2010. Not far from the 3,81 GWp in Spain.
Italy is followed by yet another "flashlight" candidate, Czech Republic, that added 409 MWp of new installations in 2009, but a staggering volume of 1.490 MWp in 2010, 3 and a half times as much as in the previous year. That market will however, collapse in 2011, since dramatic measures have been undertaken by the government to stifle speculation in their country. Czech Republic is followed by France adding 719 MWp in 2010, more than three times the volume newly installed in 2009 (221 MWp, note that these numbers include the overseas departments, DOM's).
The rest of the EU27 countries is hardly visible on this scale (see graphs below for detail). Only Belgium did very well considering its relative small size and population (due to Flander's success in implementation in 2009, and to a lower extent, in 2010). For some markets, actual accumulation data can differ considerably, depending on the source and the status of the statistical reviews. Therefore, mind the red warning (also applicable to other graphs presented on this page).
Note that for France, the results for the overseas departments ("Departements Outre Mer", DOM) also have been included in the (updated) accumulated data for 2009 by EurObserv'ER. In a previous report for that year it has been stated that they represented 25% of the grid-connected capacity in the whole country including DOM. This should be kept in mind if one wants to consider the European context focussed on the old subcontinent and its neigbouring isles. The "DOM" isles, French Guyana, and a small slice of Antarctica, all falling under a variety of administrative legislation frameworks, are scattered over the globe and are far removed from the direct "physical" influence sphere of Europe, see English Wikipedia map and accompanying clarifications.
CLICK
on graph for enlargement
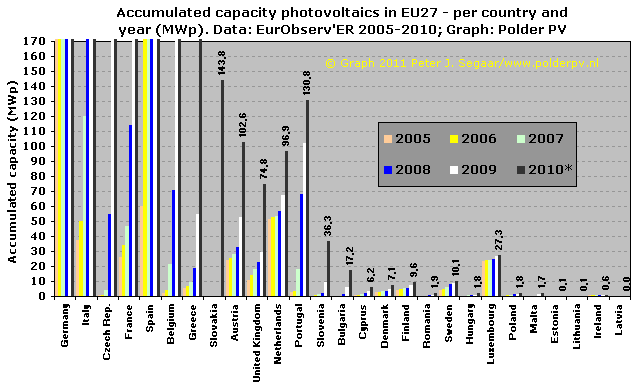
Figure 4. Same graph as Figure 3, but with a scale better outlining the data for the rest of the EU27 countries (Germany up till Greece running off the Y-axis for 2010 in this detail graph, for those 7 big markets, see Figure 2). Note the strong differences in development between the other countries: explosive growth in the highly surprising new market of Slovakia (up till 2009 almost "terra incognita" in photovoltaics and apparently on its way to replace the building frenzy in neighbouring Czech Republic? ...), good growth in Austria, United Kingdom, and - another surprise - Italy's neighbour Slovenia. And "some", but still disappointing growth in Netherlands (accumulation to be corrected to 87,7 MWp), Portugal, and Bulgaria. My own country, the Netherlands, was once on the forefront of market implementation, but it has lost contact with reality with an extremely complicated, highly capped, and hardly stimulating "incentive" regime as of April 1, 2008 (example: 17.000 applications for "small category" in 2010 on first day, only 4.218 approved; 35.000 applications for "large category" [max. 100 kWp] in 2010 on first day, only 131 applications approved because of microscopic budget...).
Note: Switzerland, not in EU27, had 69,9 MWp end of 2009 (this document), and would have added 30 MWp to reach approximately 100 MWp end of 2010 (this document updated April 2011). Hence: it has reached a level somewhere in between neighbouring Austria and the Netherlands with total accumulated capacity (Netherlands having accumulated less than EurObserv'ER estimated according to CBS).
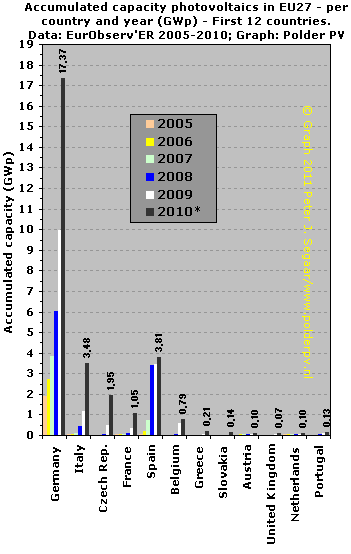
Figure 5. Detail showing the first 12 countries in the EU27 with respect to PV capacity accumulation, showing huge variation in the implemented PV-capacities (preliminary accumulated volume numbers shown for 2010 only). Again, sorting order (left to right) is based on new capacity added in 2010 (market growth). Difference between World Champion Germany and Portugal has become a staggering factor 134 in 2010. Difference with the new number 2, Italy, however, is only factor 5. This used to be a factor 8,6 end of 2009, and it is expected that Italian market growth will be stronger than the expansion of the somewhat "saturated" German market in 2011. In the remaining "top twelve", only Czech Republic, France, Spain, and Belgium showed strong growth volumes. The rest of the countries on this list added some volume, but at (very) low levels. With the crisis conditions in Greece having reached a climax, it remains to be seen how much of its long-year potential of 3 GWp waiting in the bureaucrat's pipeline will see the grid on short notice...
Netherlands did not yet reach the 100 MWp level end of 2010. CBS reported only 87,7 MWp (although their data have to be taken with caution as well, since they are derived from a shaky enquete only once a year, possibly underestimating true market realisation).
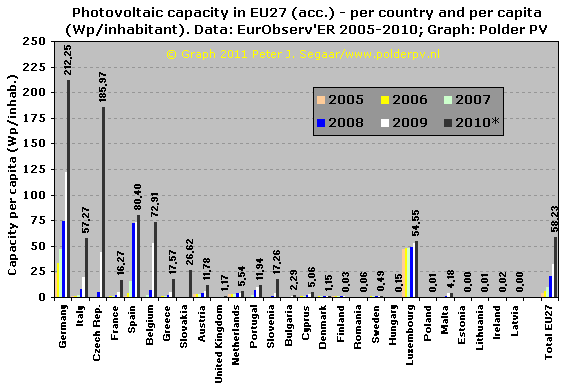
Figure 6. Accumulation of PV-capacity in EU27 countries per inhabitant/capita and per year. For this, the World Population Reference Bureau data for 2010 have been used in the calculations by Polder PV (hence: mid 2010 population as fixed reference, download pdf from this webpage). Numbers shown for 2010 only, for other years refer to the scale of the Y-axis. A very different picture emerges, with the small country Luxembourg as a suprising fifth on the podium (2009: on 3rd position), behind Germany, Czech Republic, Spain, and - another surprise - Belgium. However, Luxembourg has hardly grown in recent years and will possibly be bypassed by more countries in coming years. France - with its relative big population - still has a relative low impact in this graph but will probably grow faster in coming years. Greece remains a questionmark with respect to its deep financial crisis, but has grown notably in 2010. Two newcomers have already a considerable impact because of their relative small populations: East European Slovakia and Slovenia. Portugal is positioned relatively high within the rest of EU27, with its not too large population (10,7 million) but already 130,8 MWp of PV-installations (high impact of large field installations) according to EurObserv'ER. In the right of the graph, the average data for EU27 countries have been given. Already over 58 Watt(peak) per capita has been realized in the EU27 in 2010 (2009: 32 Wp/capita), a factor 3,6 times less on average than world champion Germany has reached in that year by itself.
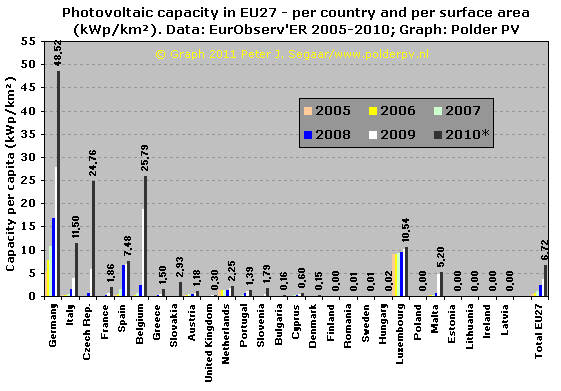
Figure 7. Graph comparable to Figure 6, but this time the (land) surface area of the countries has been taken as reference for total PV capacity installed (in kWp of PV installed per square km. of land). Again, World Population Reference Bureau data have been used, which were published in their 2006 report (data calculated from square miles into km² by Polder PV). Yet another picture emerges (numbers shown for 2010 only, order left to right based on market growth in 2010 according to EurObserv'ER data). Related to surface available, Germany again taking the lead with almost 49 kWp per square kilometre of land available in 2010. Belgium has retained its second position (reached in 2009) with almost 26 kWp/km², just before the "one-time-newcomer" Czech Republic (explosive market growth in 2009 and, particularly, 2010) - that will, however, probably not increase much further if policy with regards to legal and financial support for PV will not change. Italy has reached fourth position and will certainly decrease the gap with Germany as new data will become available (many GWp not yet accounted for in these statistics). Tiny Luxembourg now has dropped to the fifth position that is the result of "ancient" PV-support policy abolished years ago (market growth remained slow in recent years). Of course, any "significant" installation in such a small country, will have a notable impact in this graph.
Only Spain (6th position) and the small mediterranean island state of Malta (7th) have significant capacity related to their total surface area, with newcomer Slovakia trailing further behind. France, surprisingly, does not yet show a significant PV capacity/land surface ratio, but that might (rather: should) change if the market in the nuclear energy state becomes big enough and all bureaucracy is cut out of the system. Potential is overwhelming in that sunny country. Although Netherlands has reached a slightly higher level than much bigger France in 2010, it remains to be seen if that position will hold in coming years, keeping the bizarre and extremely volatile, marginal "support" by the government in mind. Average EU27 accumulation up till 2010 is 6,72 kWp per square km. of land surface. That used to be 3,65 kWp/km² in 2009, hence a doubling of volume in this ratio, in one year time.
CLICK
on image for enlargement (click twice if necessary)
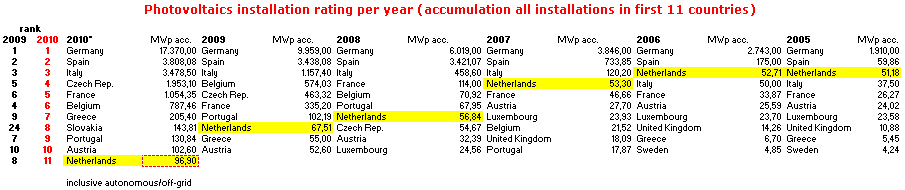
Figure 8. Rating of ten (11) best countries with respect to accumulated (total) PV capacity in 6 consecutive years (2010*, preliminary results, left, 2005 right, screendump of Excel spreadsheet). Germany and Spain leading the way from the beginning, although the latter's second position in 2010 will be occupied by surging Italy in later updates. Netherlands (marked yellow), once "the brave PV country bordering the North Sea", has given all its cards away and has gradually sunk from its respected third position in 2005 (due to a small market boom with excessive installation subsidies in 2000-2003) to an extremely bitter 11th position in 2010, out of the "upper ten" list. With little perspective that things will turn out to become better since its new "incentive" regime (SDE as of April 1, 2008) has turned out to be a totally unstimulating and heavily capped bureaucrat's nightmare full of investment uncertainties.
Besides: the accumulated capacity estimated for Netherlands by EurObserv'ER for 2010 apparently has been overrated, since it has been claimed by the national statistics bureau CBS that these data have been based on incorrect (at that time far from "complete") market data (e-mail correspondence with Polder PV, see article published on July 4th, 2011 and, in particular, the one published Sep. 12/13, 2011). Based on preliminary 2010 market data of CBS, accumulated PV-capacity in the Netherlands would have been in the order of 88 MWp end of 2010, instead of the app. 97 MWp that EurObserv'ER provided in their April 2011 report (see graph in CBS statistics update on Polder PV). This might result in a reshuffling of positions on this list: end of 2010, Netherlands might have dropped even further, to the 14th position. It is already clear from available data that Netherlands will be bypassed by United Kingdom (having implemented a highly effective microgeneration feed-in Law in 2010), in 2011.
Most surprising newcomer, occupying the 24th position in the EU27 records for 2009, is Slovakia, that shuttled itself into the 8th position in the preliminary 2010 listing of EurObserv'ER, with 144 MWp of accumulated capacity. In the previous year they only had 0,2 MWp according to EurObserv'ER...
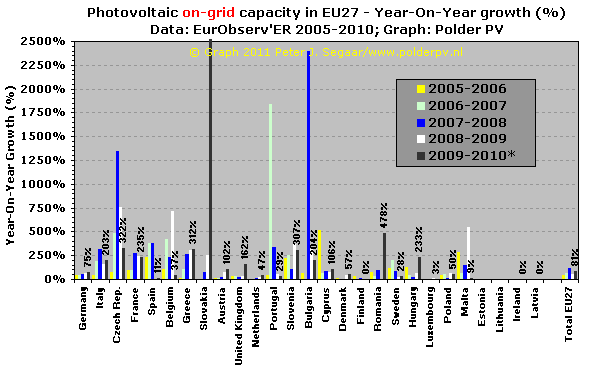
Figure 9. Year-on-year (YOY) growth of the on-grid photovoltaic markets in EU27 countries for the period 2006 to 2010*, in percentage of the previous market accumulation year published by EurObserv'ER. Actual percentages only presented for the period 2009-2010 for all countries. Yet another picture emerging. In world market Germany growth has been an excellent 75% (new world record volume of 7,4 GWp in 2010). Czech Republic showed again very strong growth of 322% (not considered "sustainable growth", and turning into deep-freeze conditions in 2011). Record breaker going off-scale is newcomer Slovakia that grew a flabbergasting 88.622% in one year time. Other remarkable growth percentages in the second-fastest relative grower Romania (plus 478%), Greece (plus 312%), Slovenia (plus 307%), France (plus 235%) and Hungary (plus 233%). Of course, when a market is still small the growth percentages will be very high (e.g., Portugal in 2006-2007, Bulgaria in 2007-2008). That is the reason that the growth in the already huge, mature world market Germany "seems" so modest in this comparison. Sun-drenched Spain has been a tear jerker in 2009 (plus 3%) and could only add 11% in the "post-collapse-year" 2010. Its growth perspective remains troublesome, since the government has turned itself away from (support for) PV, and the country is in a deep crisis.
My own rich country the Netherlands, once a "top" market for a few years, has been behaving as a very bad boy in this comparison, with low growth percentages (12% in 2008-2009, lower than growth in Sweden in Northern Europe, only minor help from the new "incentive" regime). The suggestion that in 2010 47% would have been added is not based on reliable records (in fact, they were estimated too high, as CBS and ECN Beleidsstudies admitted to Polder PV), and it should be noted that 45% of total market growth in 2010 has been realized by people that have not claimed the dreadful "national subsidy" (SDE regime). That 45% of total market volume in 2010 is not centrally registered and the electricity production is not known. In many instances these new installations are not measured with a certified meter, and "net metering" is the only incentive (up till a maximum that will be extended to 5.000 kWh of surplus put on the grid, above that only a few Eurocent/kWh can be expected)...
To the right of the graph again the average data for all EU27 countries is presented. Showing "healthy" growth percentages of 96% for the period 2007-2008, a considerable 53% in the "crisis period" 2008-2009. And again an excellent 81% for 2009-2010.
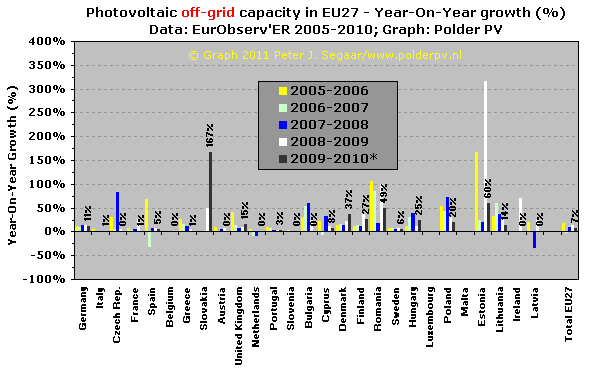
Figure 10. Same as for Figure 9, but now for the off-grid PV-systems in Europe. In view of the data provided by EurObserv'ER in their latest preliminary report, it seems that these will have to be updated (many "zero's" or grossly rounded data in the off-grid column). Based on the published data: Remarkable growth in Slovakia (plus 167%); good growth in Estonia (plus 60%), Romania (plus 49%), and Denmark (plus 37%) in 2009-2010. Considering these still nascent markets these high percentages should be taken with precaution. All-over growth rates in most countries remain low, a few up till some twenty percent per year. In Latvia and Spain apparently a significant capacity of older off-grid installations have been scrapped from the records in earlier years. Also in my native Netherlands off-grid installations (that are never monitored to my knowledge) have been theoretically removed from the statistics, in 2006-2007 and in 2007-2008. Note that "decommissioning" policy in EU 27 states is mostly paperwork instead of real-time monitoring, and the guidelines for this tricky interpretation differ between states, if they even exist. EU 27 showed growth of a meagre 7% on average in the period 2009-2010, with corrections expected in updates with better and refreshed data.
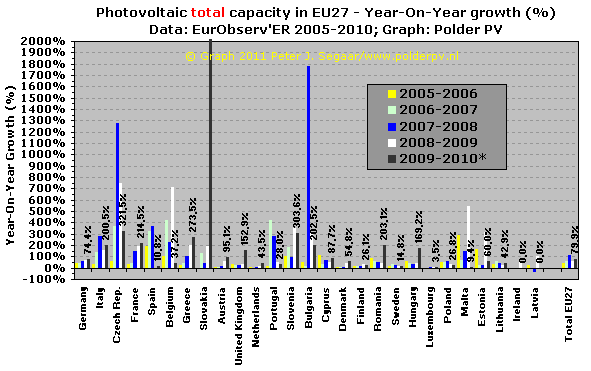
Figure 11. Graph comparable to Figs. 9 and 10, but now all PV-installations (on-grid and off-grid) are shown in one graph. Some countries showed overall growth of a few hundred percent in 2009-2010 (Czech Republic, Slovenia, Greece, France, Italy, Bulgaria and Romania), with Slovakia the ultimate exception - a growth rate of 74.801%... Further progress may occur if policies are implemented to break the existing energy oligopolies, and to give maximum room for decentralized electricity generation. General EU 27 growth amounted to a sizeable 80% in the period 2009-2010 (all PV installations).
Grafieken
met marktontwikkeling van thermische zonnecollectoren in EU27 (2005 -
2010*)
Graphs with market development for thermal solar collectors in EU27
(2005 - 2010*)
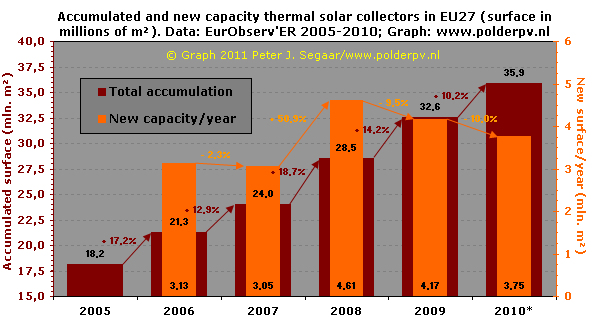
Figure 12. Thermal solar collector market development in EU27 in the years 2005-2010*. Newly added surface (million m²) per year stagnated from 2006 to 2007 (slight decrease in new capacity added), grew again strongly with almost 51% (added: over 4,6 million m²) in 2008, but regrettably dropped again 9,5% in growth into the crisis year 2009 (orange columns, right Y-axis). And a further - dramatic - overall downfall of new volume of 10% in 2010 (preliminary data). Not suprisingly, EurObserv'ER started their report with the phrase "As could be expected, the recession cast long shadows over the European solar thermal market throughout 2010". Total accumulation of all m² installed in EU27 grew, however with considerable volume in the time-span shown. YOY growth rates were 17,2%, 12,9%, 18,7%, 14,2%, and finally still a "relatively good" 10,2% in the years 2006-2010 (dark brown columns in the background, left Y-axis). Already, a surface of 35,9 million square metres had been realized at the end of 2010 in the 27 EU countries, good for 25.136 Megawatt of thermal power (MWth).
This specific solar market seems to be more sensitive to political and economic factors than the more "sexy" PV market. Another important factor, of course, is that the PV-industry has been highly successful in driving production costs faster down than most experts expected, thereby further enticing demand. Cost reduction in the thermal sister branche has turned out to be a lot more difficult. In addition, the temporary withdrawal from a good incentive in world market Germany in 2009 did not help to let this very important market segment flourish as it should. The industry still has not recovered, while its fossil fuel utilisation and CO2 emission reduction potential is massive.
CLICK
on graph for enlargement
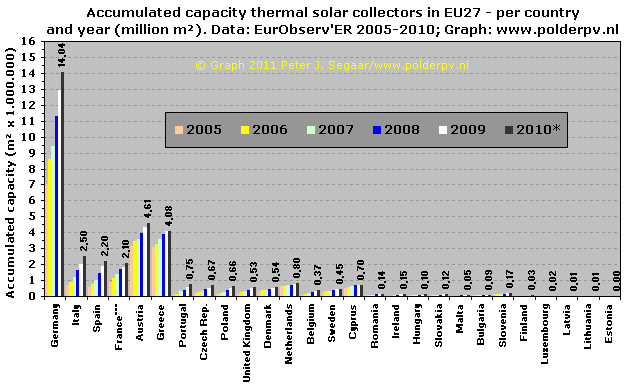
Figure 13. Surface area (in million square meters) of thermal solar collectors in 27 EU countries - accumulation per year in the period 2005-2010. Only numbers for 2010* (preliminary data) have been shown for clarity. Order of appearance (left to right) is based on market growth per country in 2010. Again, Germany leads the way in unprecedented manner (slightly over 3 times as much surface area as the number 2), followed bij their southern, also German-speaking neighbour Austria that has a long tradition with this particular sustainable energy modus. Thermal collectors can also be found on many roofs in the Mediterranean region, which is reflected in the data from EurObserv'ER: Greece leading the way and not far behind with respect to the market in Austria. Followed by Italy and Spain at a slightly lower level. Note that these latter two countries have surpassed accumulated capacity in France in 2009. My own country, Netherlands has fallen back to the 12th place with new capacity in 2010, despite a good incentive for buying solar collectors in that year. Still, it occupies the 7th position (just ahead of Portugal) with respect to accumulated capacity (see Fig. 18). Growth in Germany has been considerable in economic crisis year 2009 (added: 1,62 million m²) but appears to have realized "only" 1,17 million m² in 2010.
Note
that data for 2010 are preliminary. In particular, the accumulated volume
for Greece in 2010 reported by EurObserv'ER appears to be questionable.
In the revised 2009 data an accumulated volume of 4.076.200 m² has
been given, and a (relative meagre) 2010 market growth of 207.000 m².
Added, this would give an accumulation of 4.283.200 m² for 2010.
Strangely, EurObserv'ER has given a volume of only 4.079.200 m² for
2010. No explanation has been given for this strong deviation (large contingency
of old collectors removed from the statistics???). In conclusion: future
revisions of published data can be expected.
CLICK
on graph for enlargement
Figure 14. More detailed graph as Figure 13, better outlining the contributions of the countries with "smaller" markets (Germany, Italy, Austria and Greece off-scale). Note that, apart from these first four countries, also strong growth occurred in Spain, France and, to a lesser extent, Portugal, Czech Republic, and Poland in comparison to the volumes realized in 2009 in these countries (France including DOM's).
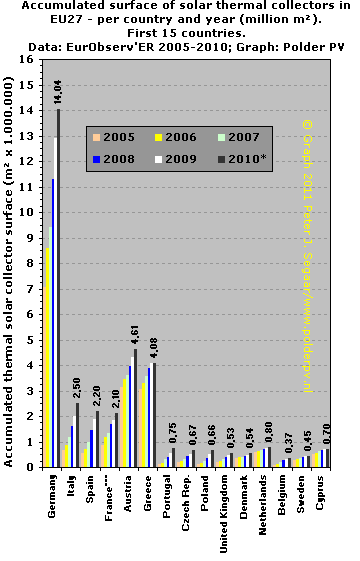
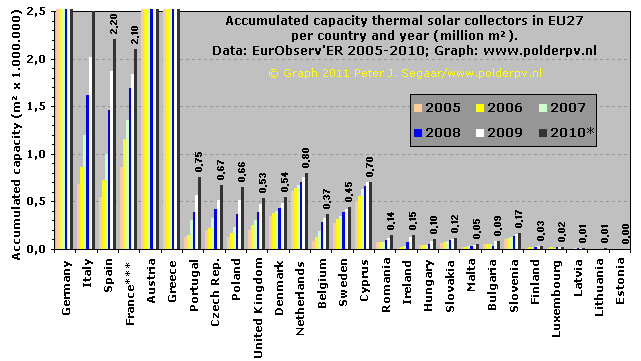
Figure 15. Detail showing the first 15 countries in the EU27, with a considerable range of implemented thermal solar collector surface areas. Order of appearance (left to right) reflects 2010 market growth volumes. The difference between the accumulated volumes between Germany and Belgium is a factor 38. The span in accumulated capacities between Germany and other markets is less great than with photovoltaics. However, the difference with the number 2, Austria, remains considerable in absolute terms - a factor of 3 in 2010. Growth in 2010 has been moderate to disappointing in most countries.
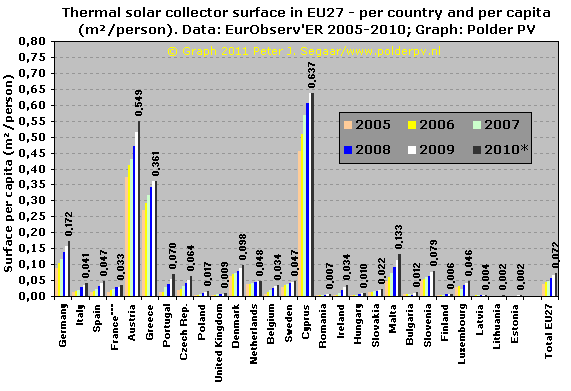
Figure 16. Accumulation of thermal solar collector capacity in EU27 countries in m² collector surface per person/capita and per year. Also for this graph, the World Population Reference Bureau data for 2010 have been used in the calculations (hence: mid 2010 population as fixed reference). And also in this picture, some other accents become visible as in the original graphs with "absolute" surface areas per country. This time, the small, sunny Mediterranean island of Cyprus leads the way, with a surface of 0,637 m² per capita. However, accumulated capacity hardly increased in comparison to 2009 ("old" capacity removed from statistics?). Germany, leader when it comes to overall surface area realized, occupies the fourth place with "only" 0,172 m²/capita because of its large population (hence: smaller ratio per inhabitant). Austria is on the second position (0,549 m²/capita), followed by the only other serious competitor Greece (0,361 m²/capita). Following Germany most other countries have less than 0,1 m² per inhabitant, with the exception of that other Mediterranean island, Malta, with 0,133 m²/pp. Denmark is on the brink of that accumulation "barrier" with 0,098 m²/pp. At the right end of the graph, the average data for EU27 countries have been given: 0,072 m² per capita has been realized in the EU27 (in 2009 that was 0,065, hence 11% growth), which easily should and could become much larger. Thermal solar energy can offset a lot of fossil primary energy use and should be stimulated with great urgency.
A similar graph can be made with the ratio MWth/capita, but this is almost identical with the graph presented here.
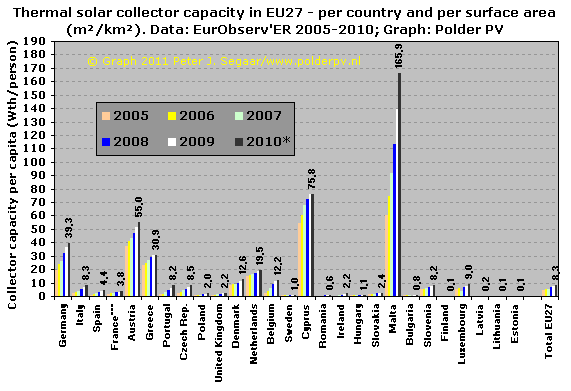
Figure 17. Graph comparable to that shown in Figure 16, but this time the total collector surface area accumulated is related to one square kilometre of land available in the country shown. Again, World Population Reference Bureau surface data for 2006 have been used for the calculation of that ratio. This time not Cyprus, but the much smaller Mediterranean island state of Malta is the best performer, with an impressive 165,9 m² of collector surface per square km. of land area. Cyprus is a good second (75,8, however: stagnation of accumulated volume with respect to 2009), this time followed by Austria (55,0), Germany (39,3), and Greece (30,9 m²/km², the latter also: stagnation). The relatively small Netherlands does well in the next league, with 19,5 m²/km². Average EU27 score is 8,3 m² per square kilometre of land in 2010 (in 2009 that ratio was 7,5 m²/km², growth of 11%).
CLICK
on image for enlargement (click twice if necessary)
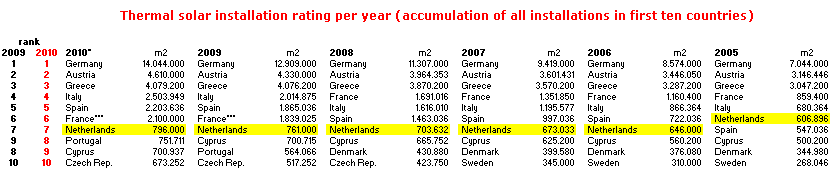
Figure 18. Rating of ten best countries with respect to accumulated (total) solar thermal capacity (in m²) in 6 consecutive years (2010 left, 2005 right, screendump of Excel spreadsheet). Comparable with Figure 8 for PV installations in EU27. Germany, Austria and Greece leading the way from the beginning, and possibly unchallenged for years to come. France (including DOM, preliminary results) was pushed downwards by upcoming Italy in 2009 in the EurObserv'ER update. In 2010 only one position in the rating has been changed: Portugal pushed Cyprus from the 8th position. Netherlands (yellow fields) has remained stable for years in this rating, after taking one step back from 2005 to 2006 due to rapidly developing Spain. It remains to be seen if the present seventh position can be kept in our troublesome country. The incentive regime for buying thermal solar collectors, heat-pumps and microgeneration Stirling machines, published at the end of 2009, has been abolished again by a Dutch government that has gone rampant with incentives for sustainable energy for civilians in the summer of 2011 (as they did with all "social" and "environmental" dossiers)...
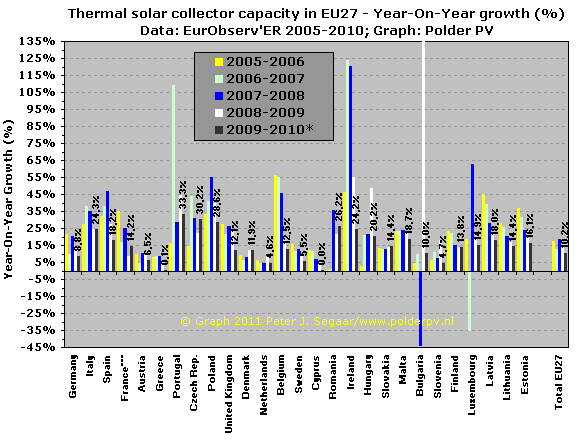
Figure 19. Year-on-year growth of the thermal solar collector markets in EU27 countries for the years 2006 to 2010, in percentage of the previous market accumulation year published by EurObserv'ER. Actual percentages only presented for the period 2009-2010 for all countries (note: 2010* preliminary results).
Yet another picture emerging, with "low" growth in world market Germany (less than 9% in the period 2009-2010). Portugal performed best with over 33% growth in 2010. Most other countries grew at moderate pace with percentages between 10 and 20%. Netherlands had a meagre growth rate of 4,6% (compared with 10% growth in 2009). The minute state of Luxembourg (part of the Benelux to which Netherlands and Belgium also belong) had a peculiar negative correction (?) of its installed capacity growth in the period 2006-2007, but started growing again considerably in 2008 (possibly new correction of installation numbers?) and 2009. Also Bulgaria showed a strong negative correction, in 2008, but "exploded" instead in the following year. Average European (EU27) growth for 2010 has been a moderate 10,2% (on far right of this graph).
http://www.eurobserv-er.org/
(homepage of EurObserv'ER)
http://www.eurobserv-er.org/pdf/barobilan10.pdf
(The State of Renewable Energies in Europe - 10th EurObserv'ER Report
- 2011; 203 pages, 10,3 MB)
http://www.eurobserv-er.org/pdf/baro202.asp
(Photovoltaic Barometer, April 2011, originally published in SYSTÈMES
SOLAIRES le journal du photovoltaïque N° 5 – 2011; 22 pages,
2,5 MB)
http://www.eurobserv-er.org/pdf/baro203.asp
(Solar Thermal Barometer, May 2011, originally published in SYSTÈMES
SOLAIRES le journal des énergies renouvelables N° 203 –
2011; 28 pages, 3,1 MB)
http://www.prb.org/Publications/Datasheets.aspx
(data sheets on world population and (2006 version) surface area by
country)
Further
reading:
http://www.epia.org/
(European PhotoVoltaic Industry Association, EPIA. See publication list
here,
including the Annual Report 2009, Market Outlook 2010, and the latest
Global Market Outlook for Photovoltaics until 2015)
http://www.estif.org/
(European Solar Thermal Industry Federation, ESTIF. See also report Solar
Thermal Market in Europe. Trends and Market Statistics 2010 [June 2011],
download from this
webpage)
Meyer, J.-P. (2011). Solarthermiemarkt Europa. - Sonne Wind Wärme 10/2011: 30.
Pagina gepubliceerd op 14 juli 2011. Addenda/corrigenda. 17 juli 2011 (toegevoegd: resultaten Zwitserland); 13 september 2011 (enkele opmerkingen over de foute opgave voor de jaargroei van Nederland in 2010 toegevoegd n.a.v. erkenning ingave blunder door ECN Beleidsstudies, art. 12/13 sep. 2011).
|